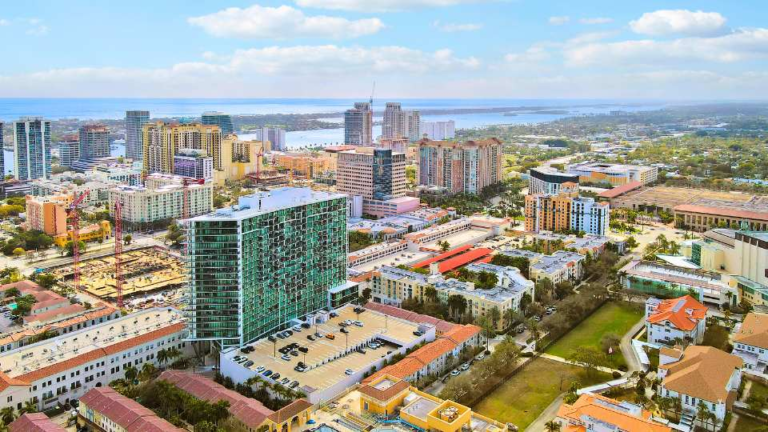
The National Association of REALTORS® Research Group’s July 2026 Commercial Real Estate Market Insights Report was recently published an in-depth analysis of the U.S. commercial real estate (CRE) landscape.
Below is a streamlined summary of critical insights for the office, multifamily, retail, industrial, and hotel sectors, alongside economic and lending trends.
Economic Backdrop
The U.S. economy kept expanding in June, though more slowly. Job gains cooled to 57,000, inflation eased to 3.5%, unemployment held near 4.2%, and Q1 GDP was revised up to 2.1%.
The Federal Reserve left rates unchanged in the 3.5–3.75% range, so financing costs for commercial real estate remain elevated. The result is a mixed backdrop: demand holds in many markets, but new investment and development stay challenging.
Office Properties
The office market posted its first positive annual net absorption in nearly four years, totaling 26.1 million square feet. Vacancy declined to 13.8%, and rent growth improved to 1.7%.
Class A properties continued to lead leasing activity, while Class B recorded its first quarterly gain in 4.5 years. Vacancy rates ranged from a low of 1.55% in Davenport, Iowa, to a high of 20.69% in San Francisco. The sector’s average cap rate stood at 8.8%.
Multifamily Properties
The multifamily sector remained resilient, with approximately 449,500 units absorbed over the past 12 months, still above long-term norms despite some moderation. Deliveries slowed meaningfully, allowing vacancy to edge down to 8.2% and rent growth to improve to 0.8%.
Class A properties showed the clearest signs of stabilization, while Class C retained the lowest vacancy and strongest rent growth. New York City, Dallas-Fort Worth, and Phoenix ranked among the top markets for absorption. The average cap rate was 6.2%.
Retail Properties
Retail recorded stronger annual net absorption of 20.1 million square feet. Vacancy rose slightly to 4.4% amid continued deliveries, while rent growth moderated to 1.7% but still outpaced most other major property types.
General retail led demand and maintained the lowest vacancy. Neighborhood Centers, Malls, and Power Centers all returned to positive absorption. Dallas-Fort Worth and Phoenix led metro-level demand. The average cap rate stood at 7.4%.
Industrial Properties
Industrial net absorption jumped 85% year-over-year to 174.5 million square feet as the sector continued to rebalance. The supply-demand gap narrowed significantly, although vacancy remained elevated at 7.5% and rent growth slowed to 1.3%.
Logistics facilities drove the majority of demand, while flex space continued to experience net move-outs. Dallas-Fort Worth and Phoenix ranked as the strongest markets for absorption. The average cap rate was 7.3%.
Hotel Properties
Hospitality conditions remained broadly stable. Occupancy held at 62.7%, still below pre-pandemic levels, while the average daily rate reached $163 and revenue per available room climbed to $102, both well above 2019 figures.
Transaction volume increased to $27.1 billion, though elevated financing costs continue to restrain broader investment activity. Kauai and Maui remained pricing leaders, and New York City recorded the highest occupancy.
Our Thoughts
Fundamentals are stabilizing or improving across most property types after a prolonged adjustment period. Pricing power remains constrained by excess inventory in several sectors, and higher-for-longer rates continue to limit transaction volume and new development.
Selective opportunities exist, particularly in stronger Class A assets and markets with positive absorption.
Click here to read the entire report.
Do you have a property to sell?
If you have a property that you need to sell, now is the time to call Quantum Realty Advisors, Inc. for a free, 30-minute consultation to discuss your immediate needs and how we can help to address them.

On behalf of our clients and strategic partners, we have successfully sell over hundreds of residential and commercial properties in most major markets nationwide.
Our team has an extensive network of highly experienced partner brokers who can assist with all the local requirements, and we will personally be there for you every step of the way.
The information provided in this website was derived from sources deemed to be reliable and is not guaranteed or warranted. All information, content, and materials available on this site are for general informational purposes only and are not intended to be legal, financial or tax advice. The information contained herein is not a substitute for professional legal, financial or tax consultation and should not be relied upon for any legal, financial, or tax matters. If you require legal, financial or tax assistance, please consult with a qualified attorney, financial or tax professional who can provide guidance tailored to your specific situation.